Blogs & News
Introducing Data Table Analytics
Accessible Analytics for All
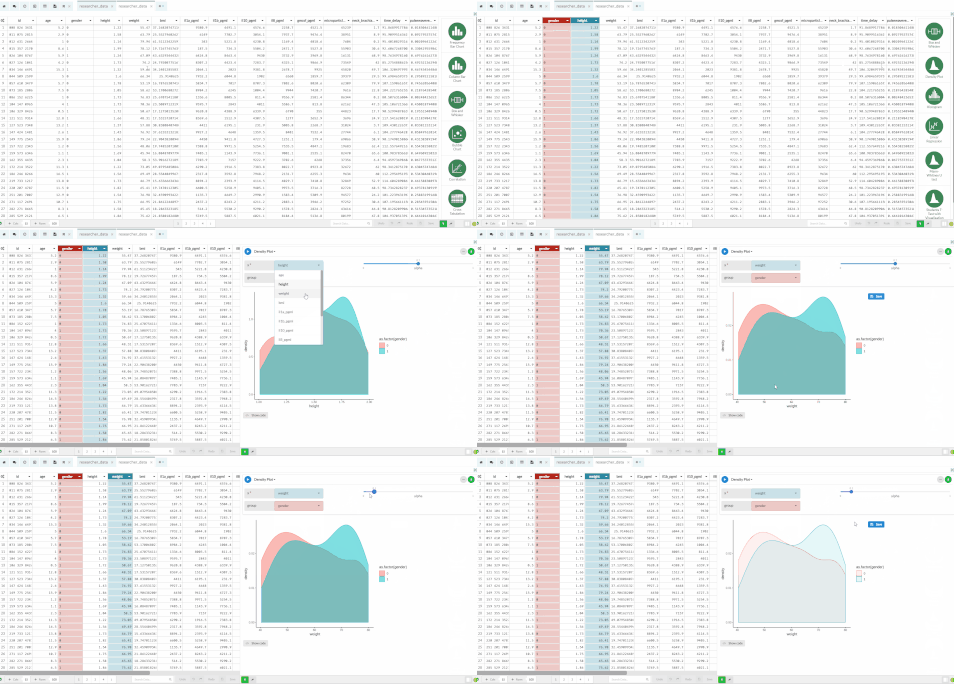
In the 1.21 version of AnalytiXagility we released the Data Table Editor, a tool for reviewing and editing tabular data and data frames within the web workspace. In this 1.22 release we have now enhanced the Data Table Editor to introduce a preview of Data Table Analytics – which gives users the ability to execute some of the most popular statistical visualisations, tests and modelling through an extensible system of analytical modules.
Analytical modules produce various charts or statistical analysis such as linear regression analysis and bar charts in a simple point and click manner. Charts and visualisations can then be saved to the workspace file system, so you can collaborate with other workspace users.
Each module can be executed using a natural column selection interface from the data table as well as manually setting parameters. This release includes the first fifteen modules of the ‘Medical Statistics Core’ bundle that will be completed in the next release.
Dr Richard Issitt, Clinical Lead of the Great Ormond Street Hospital (GOSH) Data Steward Team, was one of the first users to get early access to this feature and he said:
“The ability to easily visualise your data opens the door for those who are interested in research, but don’t have experience in data science. By automatically suggesting graphics and statistical tests for the data being analysed, we can focus on clinical data exploration and interpretation”
Data Table Analytics will make data science more accessible to all our platform users, but particularly to part-time, ‘point and click’ researchers, providing a key stepping stone for those who are making a transition towards a more programmatic approach to data science using R. To support these users, a fragment of R code is automatically generated as part of each visualisation or chart. This code can then be easily copied into a file or executed in the embedded workspace R Console.
For that extra helping hand for new users, documentation is provided for each module in our knowledge base, including links to best practice from the statistics and R communities.
Example modules
November 16, 2018
Emma McDonald
Emma joined Aridhia in July 2015 on an industrial placement from the University of Glasgow MSc Stratified Medicine course, and was invited to take up a permanent post on graduation. During this placement Emma gained practical training in the hands-on science of stratified medicine at the intersection of computing, genetics and healthcare delivery, and completed her dissertation, entitled ‘Review of Genomic Visualisation Techniques for Clinical Application’. Emma received an MSc (Distinction) in Stratified Medicine and Pharmacological Innovation (SMPI) in 2015, and also holds a BSc (Hons) Neuroscience from the University of Glasgow.
